XGEN Reporting – User Guide
3 Easy Steps: Define – Design – Deliver
CyberHound’s XGEN Reporting provides System Administrators with a modern platform with streamlined reporting functionality.
These Reporting functions are consolidated to one area with one click to the top data sources.
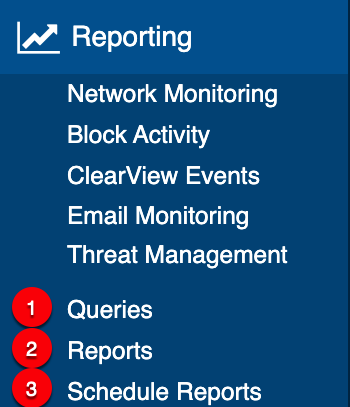
- ‘Queries’ accesses all the data sources for analytics, modify and save.
- ‘Reports’ to build and design detailed reports.
- ‘Schedule’ for easy distribution options.
IMPORTANT TO NOTE – Data Source Access: Permissions can be provided for specific User Groups, allowing report recipients to investigate results directly in CyberHound and only access ‘Queries’. Permissions can be managed to restrict user visibility to only relevant results e.g. limit to view a specific student cohort but exclude others. A user can modify queries for investigation, but are unable to delete or save. (Refer Data Source Access and Permissions document)
Data Sources: Queries are grouped by the data source they belong to. These are the data sources available:
Network Monitoring, Block Activity, ClearView Events, SpeakUp Events, Email Monitoring, SMTP Block Events, Content Acceleration Platform, YouTube Analytics, Blacklist Activity, Network Interfaces, Link Uptime, Agent Events, Welcome Page View, Certificate Checks, Host/Username associations, HTTP AV Event, Threat Management, GeoIP Events.
NOTE: Each site may have different data sources dependant on modules enabled.
1. Queries – Define requirements
Queries allow refinement of the data to produce specific results. Queries can be used in real time, for any time period, for specific details that need to be addressed or investigated e.g. activities on single user or groups. Commonly used queries can be saved to view again and these custom queries can be used for building reports.
Note: The available data sources depend on the modules activated on an appliance.
Default & Custom Queries
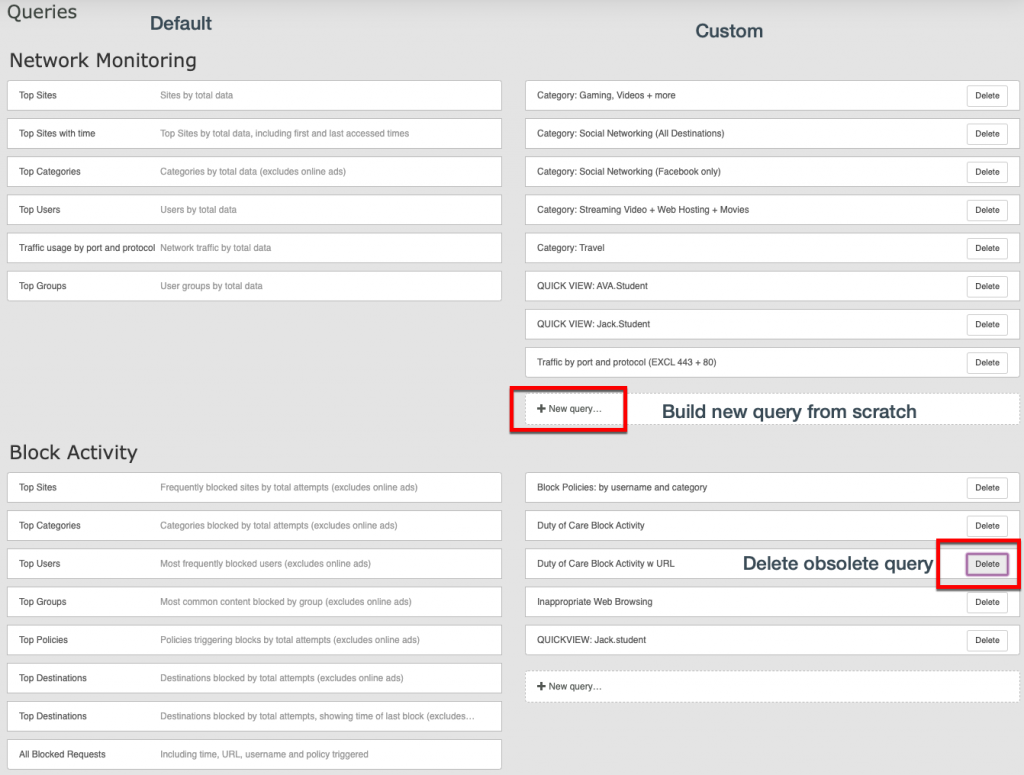
CyberHound XGEN Reporting provides a set of default queries (high level overview) and you can create custom queries to focus on specific activity. Selecting ‘Queries’ on the navigation sidebar will load all the data source queries available in a block view. They are grouped by default queries (left hand side) and custom queries (right hand side). Any custom queries can be deleted from this screen if no longer required. Default queries cannot be deleted. There are two option for creating a new query.
- Select ‘+New query’ and building from scratch
- Use an existing query to modify and ‘Save As’.
Selecting one of the ‘top’ data sources from the navigation sidebar will load a default query with the option to select and view other queries by selecting:
- The query name on header e.g. Top Categories to open drop down list.
- ‘Load Query’ on the top right of page to open drop down list.
- Access to a different data source view by selecting the data source name for drop down list.
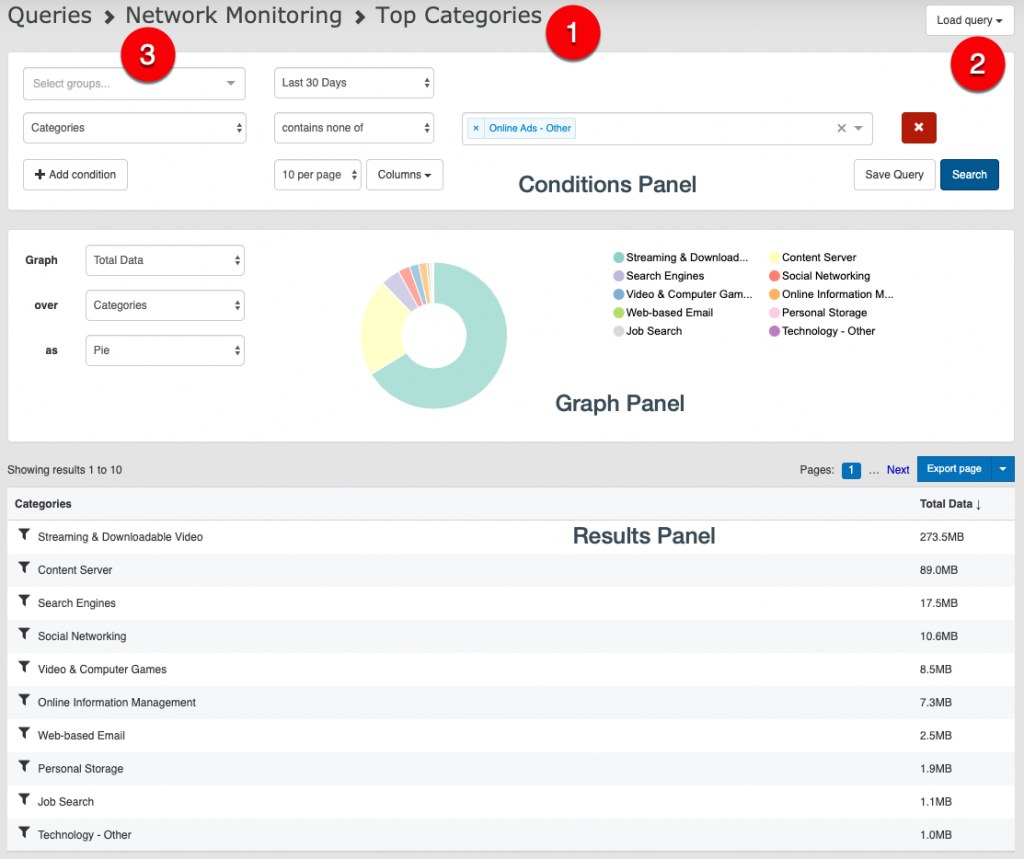
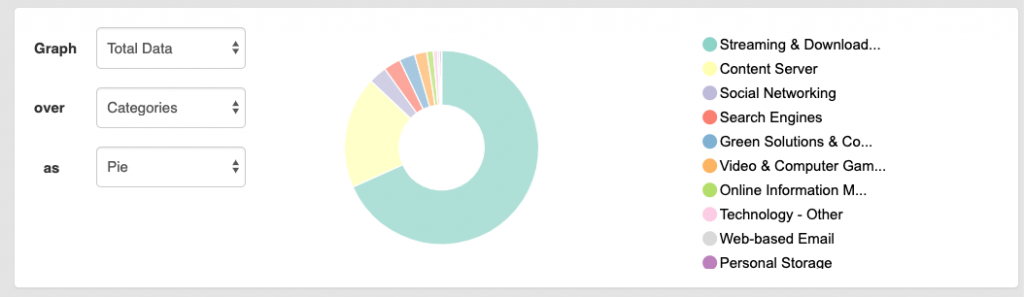
Query Panels – Conditions, Graph & Results
The Query page is grouped into three panels as demonstrated above.
Conditions: The top panel contains controls that allow modification of the query to define the required results.
Graph: Most queries are configured to display their results in a graph. The exceptions are queries that produce lists of individual events that do not make sense to show in a graph.
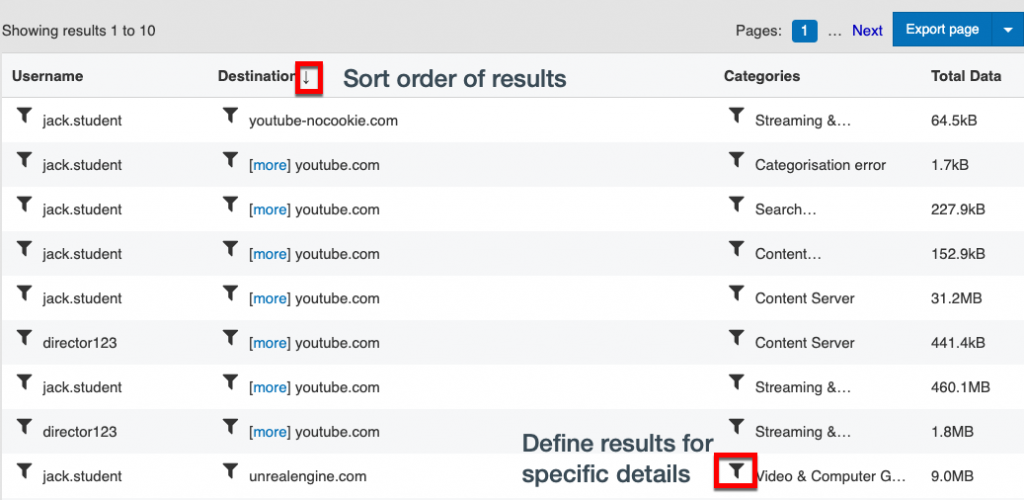
Results: The bottom panel is a table displaying the query results. If there are more results than can be displayed on one page, a pagination control will be active on the right hand side on the results table. Click on ‘Next’ or ‘Previous’ to move through the pages.
Results: Export Data Select ‘Export page’ button to download results in a CSV file format which can be imported to spreadsheet programs. Export results for displayed page or all pages (select the drop down arrow). Exporting the data allows results on specific incidents for future reference be available, as each data source has a maximum records age.
Condition Panel
Queries can be built on one or a collection of conditions to obtain the desired results.
Note: For large data sets and long time periods queries can take considerable time, if they run for more than 60 seconds, it will be terminated. A dialog will open to create a temporary report from the query to be generated once over night and emailed to the selected recipients. It is recommended that for ad-hoc queries and when building or modifying, shorter time periods are selected.
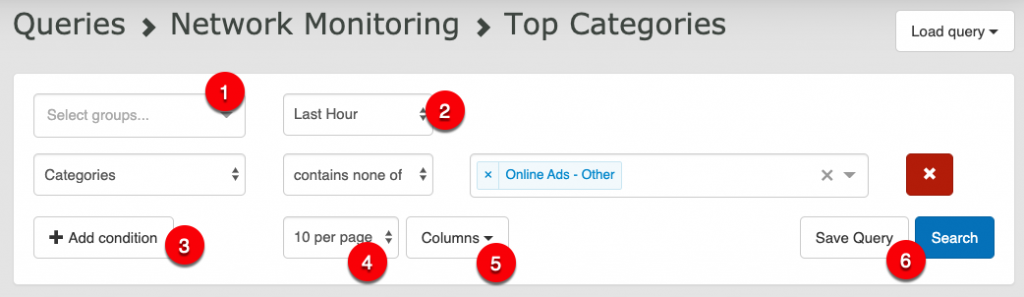
- SELECT GROUPS: refine the results to a specific user group. If no selection is made, then results will return all user groups’ activity. Note: Queries do not need to be saved with group conditions as the scheduling of reports will define the results delivered. Some data sources do not recognise groups. e.g. Email Monitoring or Threat Management.
- TIMEFRAME: refine data to specific periods, options available from hours, last week, current month, quarters and all of time. All of time is limited to each data source maximum record age. Use ‘Other’ option where specific dates can be entered. Note: Queries do not necessarily need to be saved with time conditions as the scheduling of reports will define the timeframe delivered.
- MODIFY OR ADD CONDITIONS: Click ‘+Add condition’ to add data or modify the existing condition to refine results. The ‘Conditions’ row is in three parts with the first selection determining the second and third options of drop-down or pre-defined fields. The third selection may also have a free text field option and some conditions will require that naming conventions match e.g. Block Policy, Rule or Username. Add multiple conditions as needed to define results for specific details. The drop-down options available will vary between the different data sources. Click on the red X to remove from query.
- RESULTS PER PAGE: Add more results to the page by selecting the options from the drop-down menu. Options from 5 to 500 per page are available.
- COLUMNS: The headings in the results panel are determined by the selections from the list. Tick or untick the options in the drop down list to set the results displayed. Each data source will have different selection options.
- SAVE & SEARCH: Click ‘Search’ and the graph and results will be updated to reflect the new selections. ‘Save Query’ (over writes) or ‘Save As’ (create new) for future use or to add to a report. ‘Save As’ is enabled once the name is changed and an arrow is available to select this options. (Refer Saving Queries section for further details)
TIP: Clicking ‘Search’ as you add each condition may help determine the need for more or less refinement of the query conditions.
Graph Panel
The option is available to change the graphical display by choosing from the drop-down options for all three fields (if available). However the query graph is saved, is how it will appear in any reports where graphics are required to be viewed.
Results Panel
The results panel will display as a table with different viewing options available and drill-down capabilities. To add more columns of data to the results table, select the Conditions panel ‘Columns’ drop down list and tick the additional data required to be displayed.
Sort: There is flexibility to sort the results by clicking on the column header name to change the order. An arrow will display to show the order direction, click again to toggle between directions.
Define Results: Click a funnel symbol beside a result to remove the results from the table to add it to the condition panel to define the results. In the example below, clicking the funnel symbol beside Video & Computer under the heading Categories will define the results to this one Category.
Saving Queries
Queries can be saved to re-use at a later date for quick reference or to add to reports. There are two options:
- ‘Save Query’ to update any modifications to an existing query or
- ‘Save As’, change the name to create an additional query in the custom list.
IMPORTANT: Modifying and saving an existing custom query will update the query in every report using the query.
Saved queries will be available in the custom list for all users to view, however the data displayed will be defined by the user’s data source permissions. e.g. If a user is excluded from viewing a Group’s data, the data will NOT be available to view. (Refer Data Source Access and Permissions document)
Unable to Save or Delete?
A users access and permissions may restrict the function of saving or deleting a query. Modifying the conditions is available to investigate results as required. The IT System Administrator manages access permissions and has full access to save a query for future visibility.
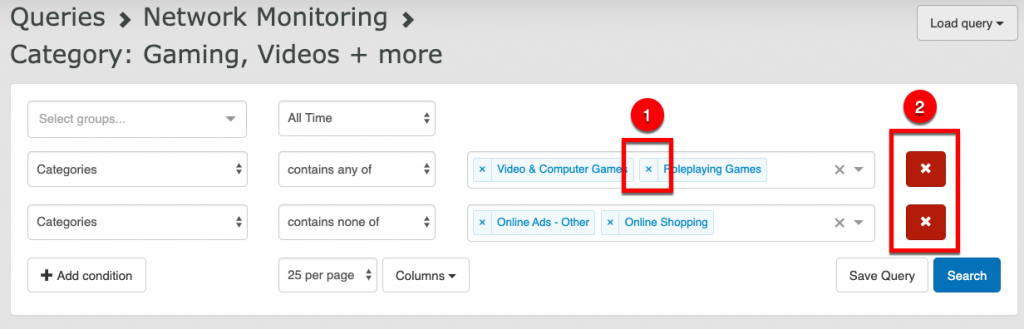
Deleting Conditions
Simply click the X checkmark for any selections not required, either the elements (1) or whole row (2) within the selection field.
2. Reports – Design
The XGEN Reports selection provides the ability to view, create and manage reporting.
- Filter Reports
- Create Reports
- Edit, Delete or Duplicate
- Generate a report
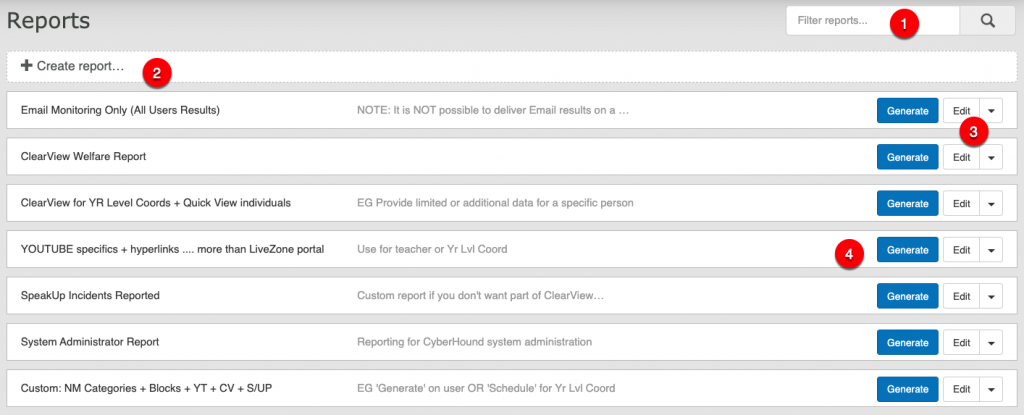
1. Filter Reports
The ‘Filter Reports’ function, searches on a report name or description and reduces the list to display those reports matching the search parameters. Typically used to search for a report that may need amendments or to locate a report to duplicate and re-work.
2. Create New Reports
Select ‘+Create report’ to build a new report by scratch, type the name of report, add report description (optional) then ‘+Add item to report’. Select from the list of the data source and then the relevant queries. Use section breaks (see following) to add headings between queries and/or instructions.
Another way to design a new report is to utilise an existing report, duplicate (see following), then edit to make the necessary changes to achieve report requirements. Each query or section break added, can be dragged up or down the list to position where required.
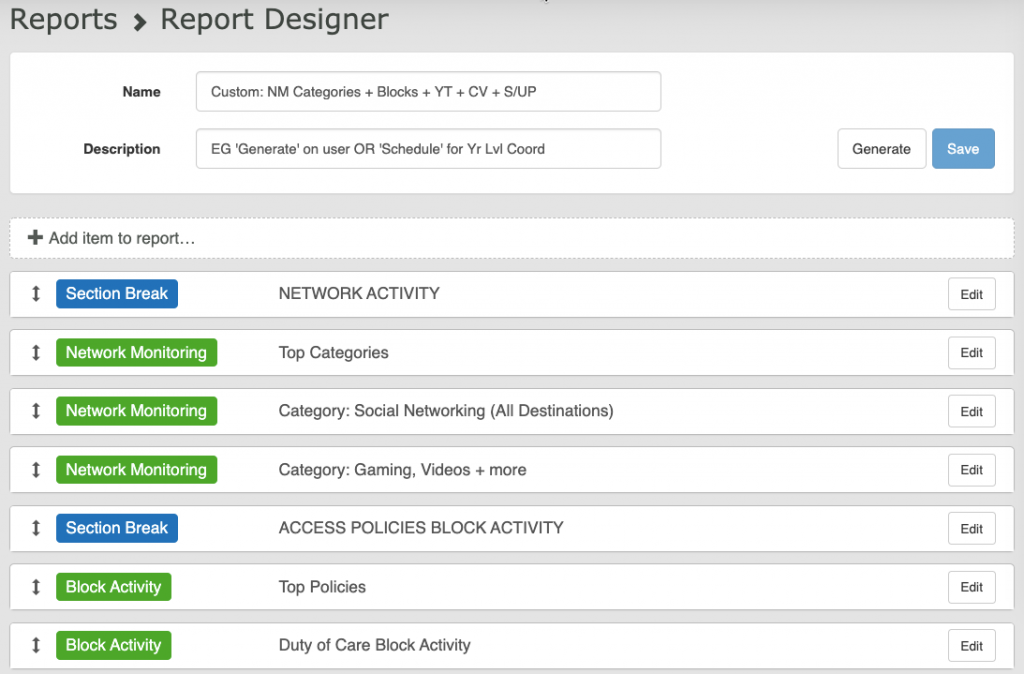
Section Breaks
Section breaks can be inserted to separate the data results and state the purpose of the section. Create a section break by selecting: +Add item to report > report components > section break
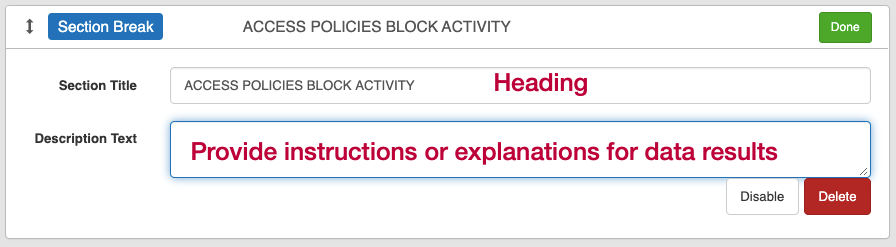
Once added to report, select ‘Edit’ to complete the details for the Section Break. Add an appropriate title and description to provide details.
3. Edit, Duplicate & Delete Reports
EDIT REPORT: Select ‘Edit’ on an existing report to open to add more queries, modify query parameters or change the name and description of the report. Once changes are made, select ‘Save’ to retain modifications.
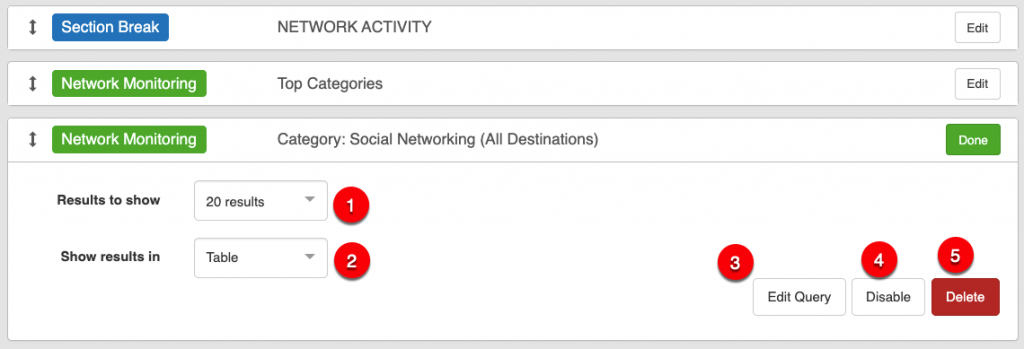
EDIT QUERY: ‘Edit’ the query to change how the results for this query will be displayed in the report when delivered. Each query added to a report can be displayed differently dependant on the following settings.
- Results to show: Choose how many rows of results are displayed in report. Default is display 10 – Max is 100. NOTE: reports delivered to staff maybe missing activity. Do they have access to investigate missing data? e.g. ClearView Welfare reports may have false positives, resulting in key events not being visible in delivered reports.
- Show results in: Choose to display the graphics or table of results or both.
- Edit Query: to open the query for changes. When Query is saved it will update the query in all reports where added.
- Disable: will ‘turn off’ the query in the report, no results will be visible until it is enabled again. Disabled queries will display greyed out, to make it easy to identify inactive queries in report.
- Delete: removes the query from the report design.
DUPLICATE: Select ‘Duplicate’ from the drop-down beside the ‘Edit’ button to duplicate a selected report.
A copy of the report will be added to the bottom of the list of reports. The copy of the report can then be edited, modified and saved as a new report which reflects the requirement for another user.
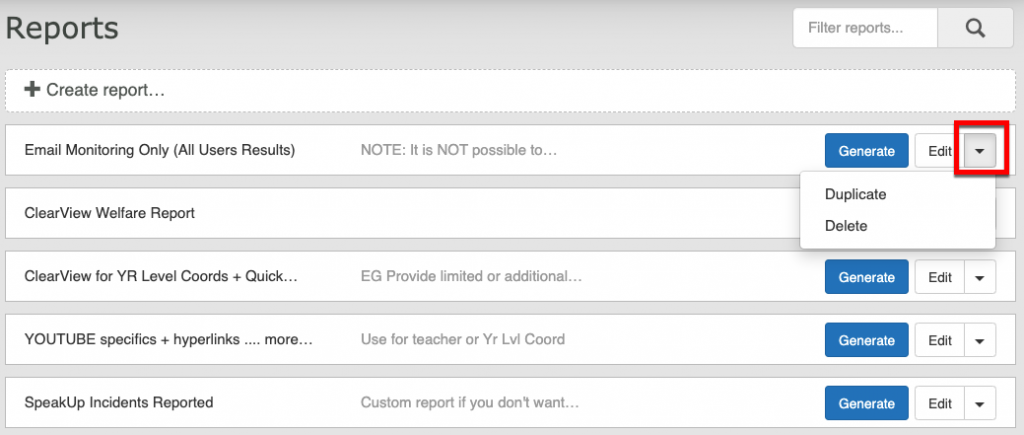
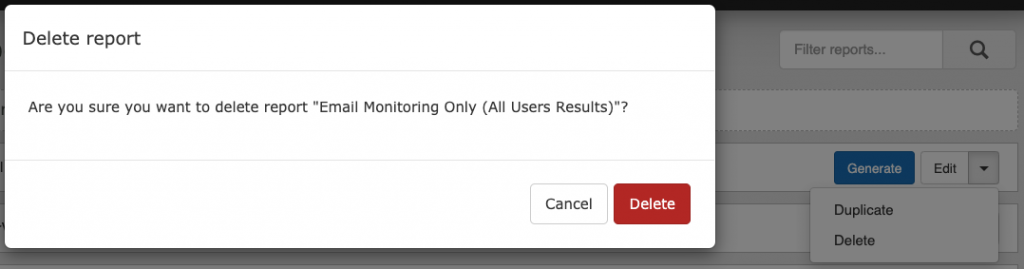
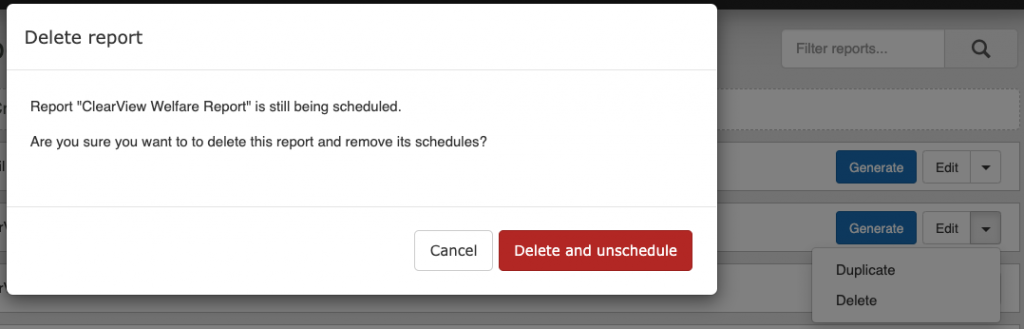
DELETE: When a report is no longer required, simply select ‘Delete’ from the drop-down option beside the ‘Edit’ button to remove the report from the list. A confirmation to delete will display, select ‘Delete’ to remove or ‘Cancel’ to return to the report lists. If the report to be deleted has been scheduled, the prompt will indicate it is a scheduled report.
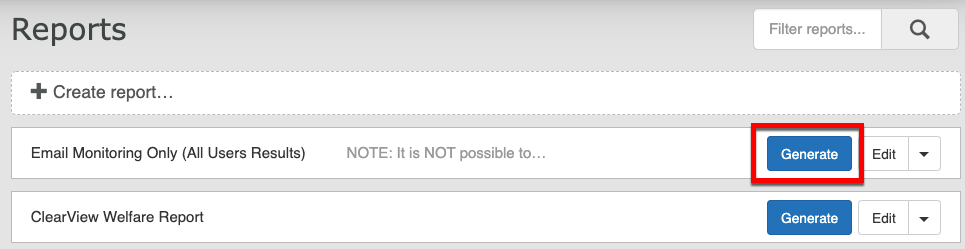
4. Generate Reports
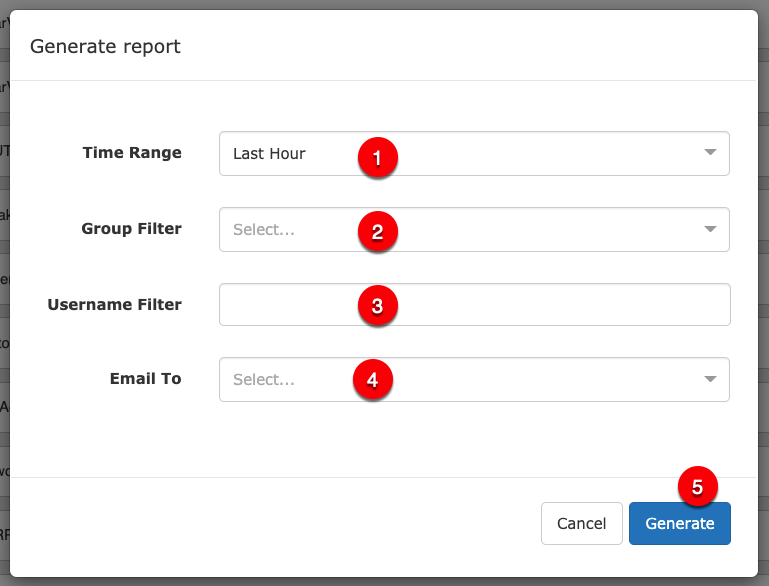
A System Administrator can preview a copy of the report in a new tab on the browser or complete the fields and email directly for ad-hoc requests. Select ‘Generate’ to open the selection fields.
- Time Range: select from the drop down list.
- Group Filter: Option to use drop down list for a specific group.
- Username Filter: Option to type in the username of an individual.
- Email To: Option to add an email address.
- Click Generate: If no email address it will open a copy of the report in a new browser with access to ‘see query’ or [more] to investigate . If an email address is added it will be sent directly to recipient.
Note: Some data sources have no underlying group or username data. Any queries from these sources will show no results when attempting to apply a filter.
Note: For large data sets and long time periods report generation can take a considerable time e.g. longer than approx. 60 seconds, it will timeout and a dialog box will present to schedule as one-off for overnight delivery to an email address. It is recommended that for preview purposes shorter time periods are selected and the reports for longer periods are scheduled and generated overnight.
3. Schedule Reports – Deliver
Schedule Reports allows for System Administrator to send any report to nominated email addresses. There is the flexibility of adding the same report and schedule each one differently based on the recipients requirements. Scheduling saves time for Sys Admin by building one query and designing one report and using the schedule to deliver different data results based on selections added.
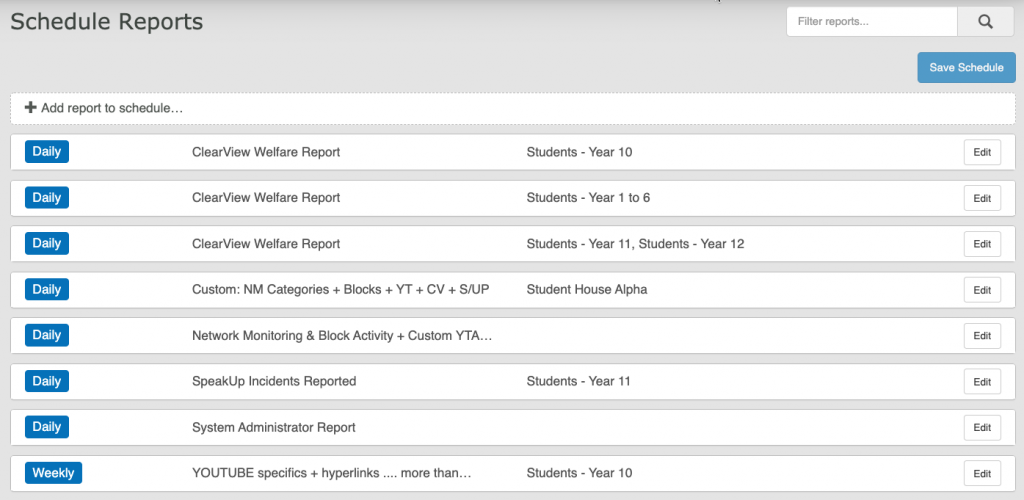
Add report to schedule
Selecting ‘+Add report to schedule’ provides a drop-down list of reports that have been saved in the Reports design section. Simply choose the report required to be scheduled.
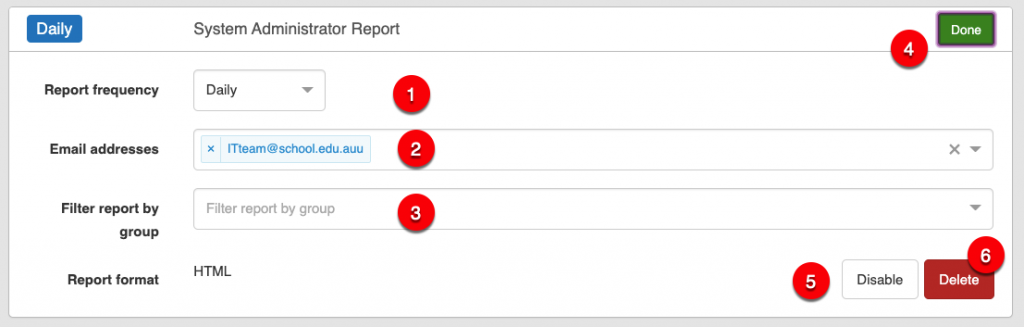
Enter the details required for the report:
- Report Frequency: choose options from Daily, Weekly, Monthly or Quarterly.
- Email Addresses: enter as many email addresses as needed. If no email address is added, a message to indicate one is required will display in red.
- Filter report by Group: Select from the drop down list a specific group for the email recipient. If no group is added it will send results for every user on network.
- Done: expands and collapses the schedule report view.
- Disable and Enable: simply toggle to disable and enable. When disabled the report header will be greyed out and will place the report on hold until required.
- Delete: to remove the report from the schedule altogether.
NOTE: It is important to apply the appropriate group filters for the report to ensure that the data contained in the reports is relevant for the intended recipient(s), i.e. the data source permission and group exclusions of email recipients is not taken into account when scheduling the report. Any email address could be added to a scheduled report and may inadvertently be distributed to a recipient not intended to view the data.
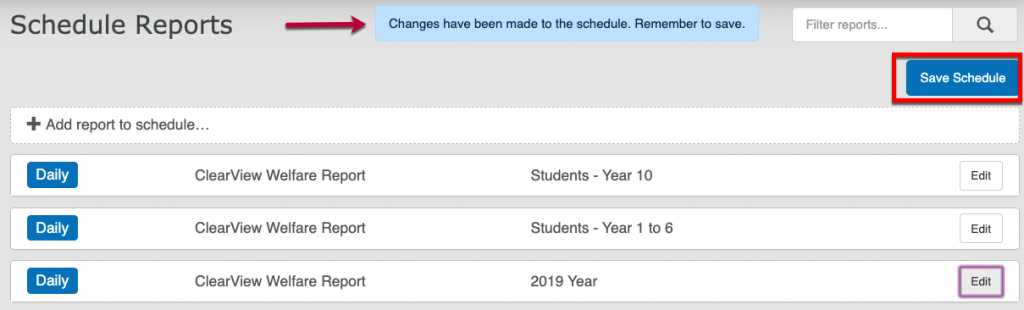
Save Schedule Reports
When changes are made to the schedule, before exiting the page, remember to ‘Save Schedule’ to retain the additions or deletion of reports. A prompt at the top will display as a reminder to save the changes.
Filter Schedule Reports
The ‘Filter Reports’ function, searches on a report name, email address or group and reduces the list to display those reports matching the search parameters. Easy to search for a report that may need amendments e.g. replacement of an email address or group updates.