ClearView – Data Analytics via Queries
The following illustrates how a user with permission to access ClearView results can view and modify data. A CyberHound System Administrator manages staff access and permissions. (Sys Admin refer to website knowledge base for info to set permissions and manage the reporting)
TOPICS
- Access to Review
- Queries Define requirements
- Query Modify the Conditions, Graphs & Results
- ClearView Custom Queries
- Remove False Positives
- Report Limited Activities
Access to Review
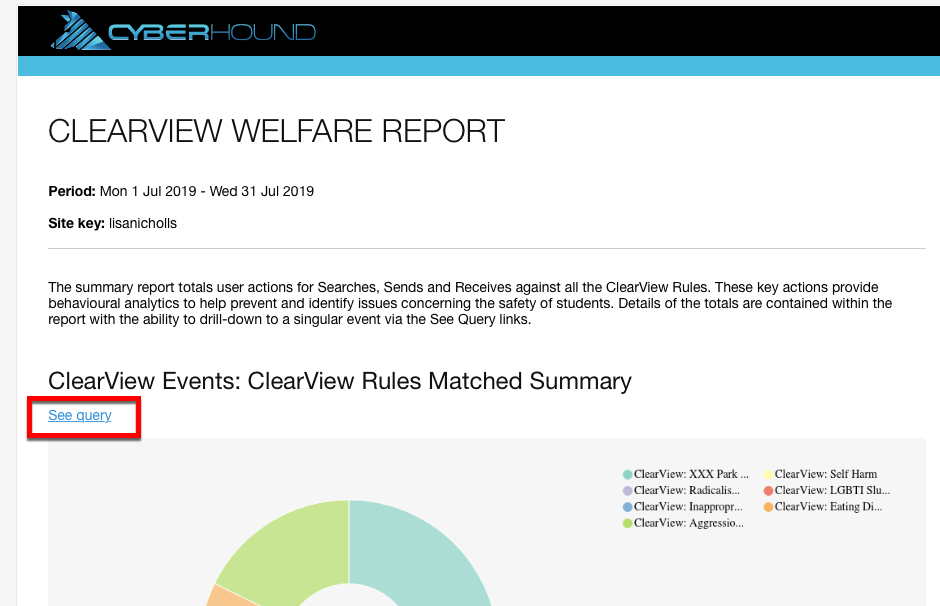
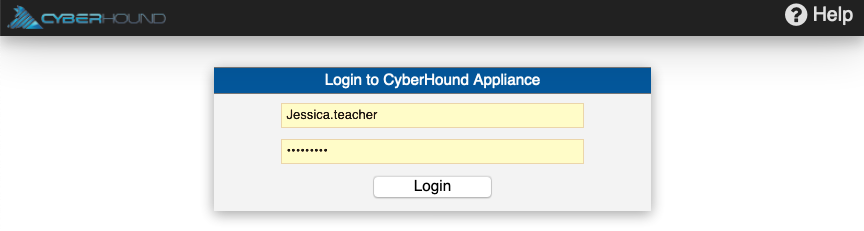
Access to Queries is via a report and logging into the CyberHound Appliance. Click on ‘See query’ form the report that has been delivered to access the results. There will be a prompt to login, simply use your normal username and password login credentials. If unsure, please ask your System Administrator how to access the CyberHound Appliance. There are two main reasons for accessing queries:
- Investigate new activities or review history for patterns of behaviour.
- Report has limited results displayed, view all activities via Query.
Queries – Define requirements
Queries allow refinement of the data to produce specific results. Queries can be used in real time, for any time period, for specific details that need to be addressed or investigated e.g. activities on single user or groups. Commonly used queries can be saved to view again and these custom queries can be used for building reports.
Default & Custom Queries
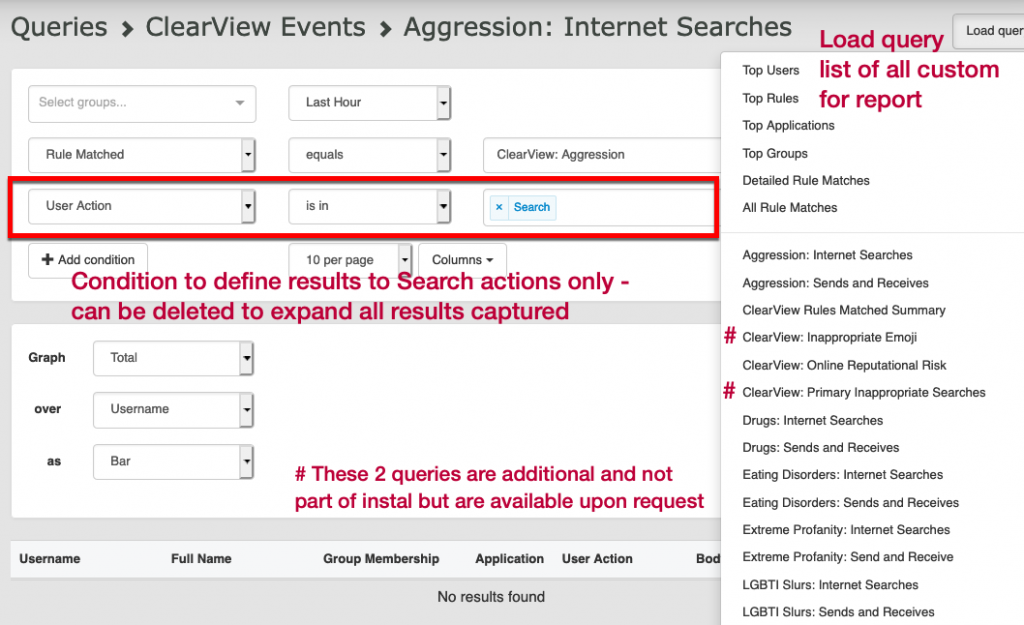
CyberHound Reporting provides default queries for each data source and are grouped by the data source they belong to. Selecting ‘Queries’ on the navigation sidebar will load the data source queries available in a block view. They are grouped by default queries (left hand side) and custom queries (right hand side). CyberHound has already created all the queries required for the ClearView Welfare report and these are all available to view in the custom block. Typically a Welfare staff member will have access to both ClearView Events and SpeakUp Events.
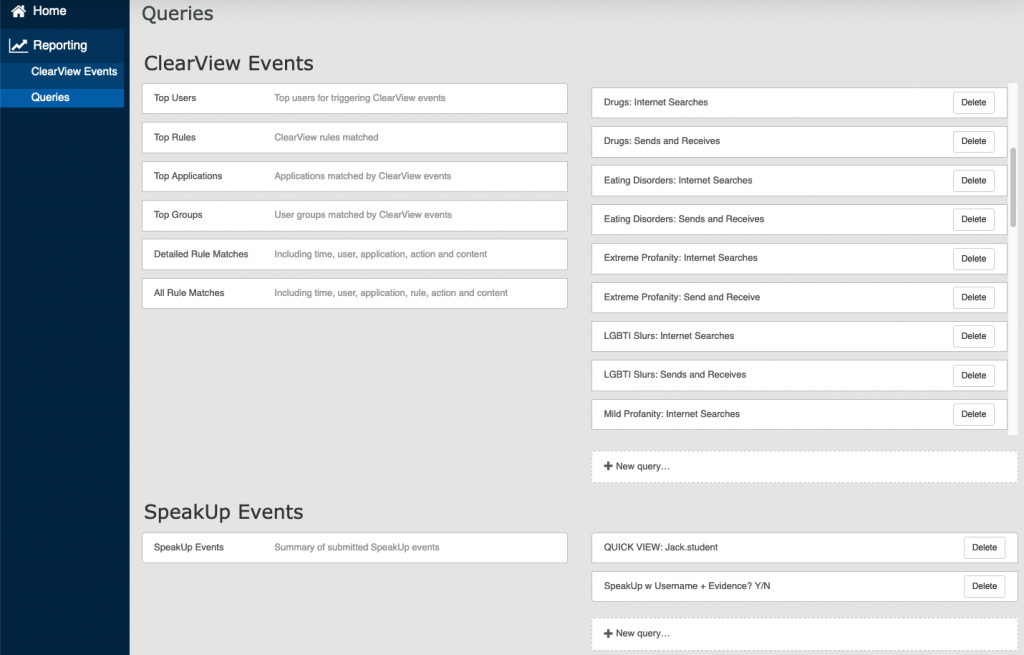
Selecting ‘ClearView Events’ from the navigation sidebar will load the default query ‘Top Rules’ with the option to select and view other queries by selecting:
- The query name on header e.g. Top Rules to open drop down list.
- ‘Load Query’ top right on screen to open drop down list.
- Access to the SpeakUp data source view by selecting the data source name for drop down list.
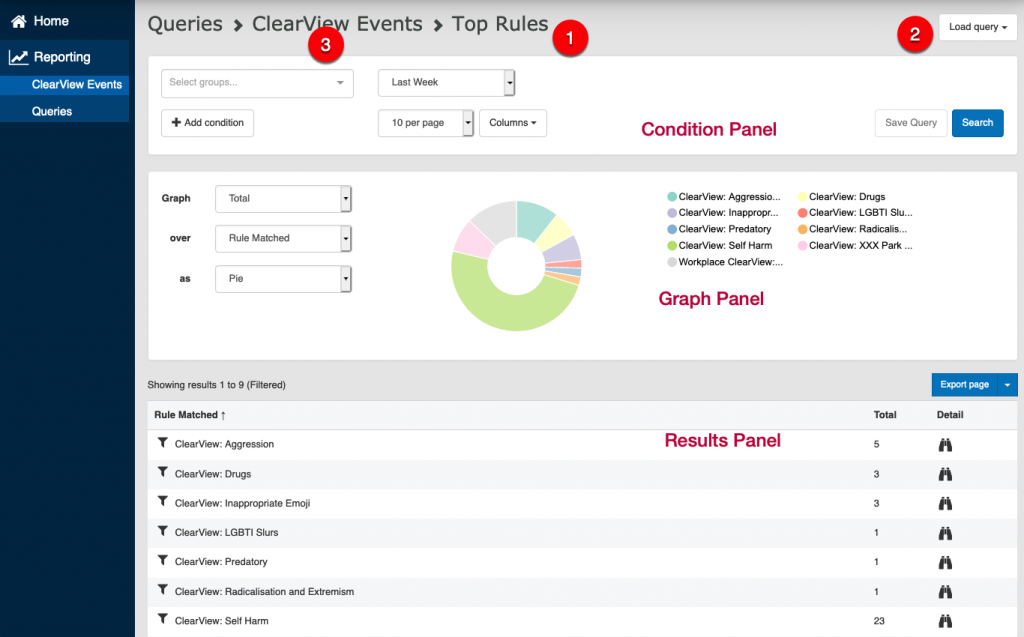
Query Panels – Conditions, Graphs & Results
The Query page is grouped into three panels as demonstrated above.
Conditions: The top panel contains controls that allow modification of the query to define the required results.
Graph: Most queries are configured to display their results in a graph. The exceptions are queries that produce lists of individual events that do not make sense to show in a graph.
Results: The bottom panel is a table displaying the query results. If there are more results than can be displayed on one page, a pagination control will be active on the right hand side on the results table. Click on ‘Next’ or ‘Previous’ to move through the pages.
Results: Export Data Select ‘Export page’ button to download results in a CSV file format which can be imported to spreadsheet programs. Export results for displayed page or all pages (select the drop down arrow). Exporting the data allows results on specific incidents, to be available for future reference, as each data source has a maximum records age. ClearView data results are held for approximately six months, SpeakUp is 365 days. Data held will be different for each CyberHound Appliance and a System Administrator can confirm the records age for each data source.
Condition Panel
Queries can be built on one or a collection of conditions to obtain the desired results.
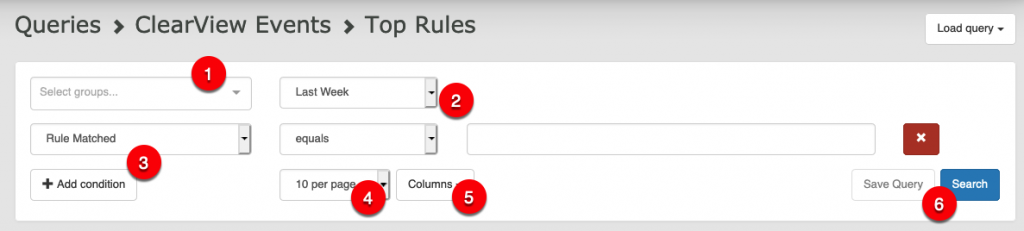
- SELECT GROUPS: refine the results to a specific user group. If no selection is made, then results will return all user groups’ activity. Note: Depending on the permissions granted, the list of groups available to view may be restricted.
- TIMEFRAME: refine data to specific periods, options available from hours, last week, current month, quarters and all of time. All of time is limited to each data source maximum record age. Use ‘Other’ option where specific dates can be entered.
- MODIFY OR ADD CONDITIONS: Click ‘+Add condition’ to add data or modify the existing condition to refine results. The ‘Conditions’ row is in three parts with the first selection determining the second and third options of drop-down or pre-defined fields. The third selection may also have a free text field option and some conditions will require that naming conventions match e.g. Rule name or Username. Add multiple conditions as needed to define results for specific details. The drop-down options available will vary between the different data sources. Click on the red X to remove from query.
- RESULTS PER PAGE: Add more results to the page by selecting the options from the drop-down menu. Options from 5 to 500 per page are available.
- COLUMNS: The headings in the results panel are determined by the selections from the list. Tick or untick the options in the drop down list to set the results displayed. Each data source will have different selection options.
- SEARCH: Click ‘Search’ and the graph and results will be updated to reflect the new selections. ‘Save Query’ (or delete) is a functionality only available for the System Administrator. If you need a query saved for future reference, screen shot your requirements and your System Administrator can make it available in the custom list.
TIP: Clicking ‘Search’ as you add each condition may help determine the need for more or less refinement of the query conditions.
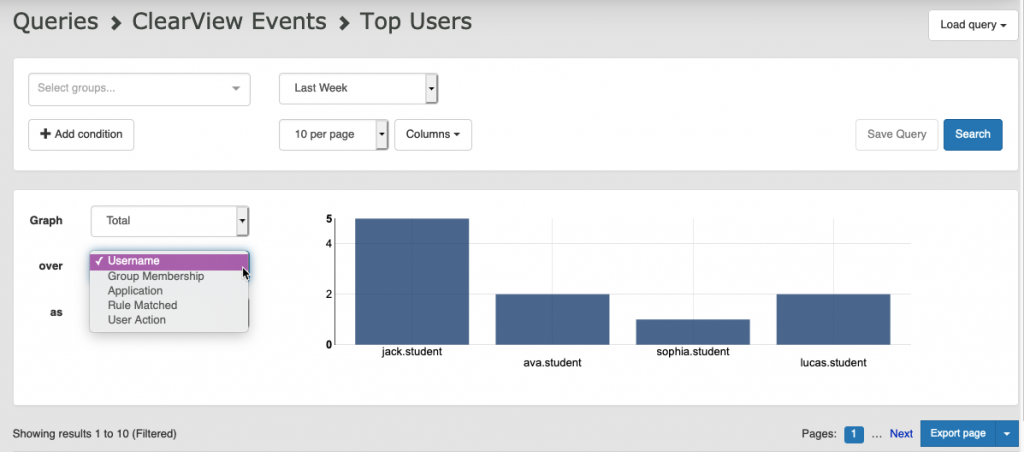
Graph Panel
The option is available to change the graphical display by choosing from the drop-down options for all three fields (if available).
Results Panel
The results panel of the query will display as a table with different viewing options available and drill-down capabilities. The ability to drill-down for granularity of the results is achieved by clicking on the binocular symbol or [more] (if available). To add more columns of data to the results table, select the Conditions panel ‘Columns’ drop down list and tick the additional data required to be displayed.
Sort: There is flexibility to sort the results by clicking on the column header name to change the order. An arrow will display to show the order direction, click again to toggle between directions.
Define Results: Click a funnel symbol beside a result to remove the results from the table to add it to the condition panel to define the results. In the example below, clicking the funnel symbol beside Jack Student, will add the username Jack.Student to the conditions panel.
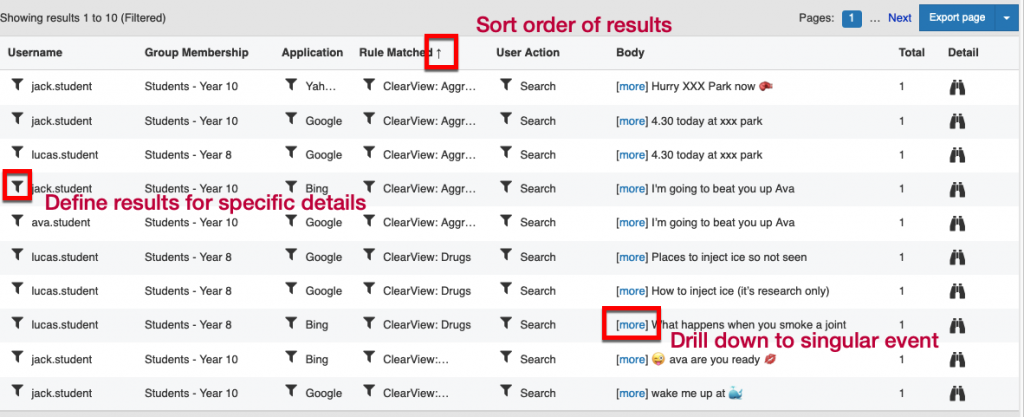
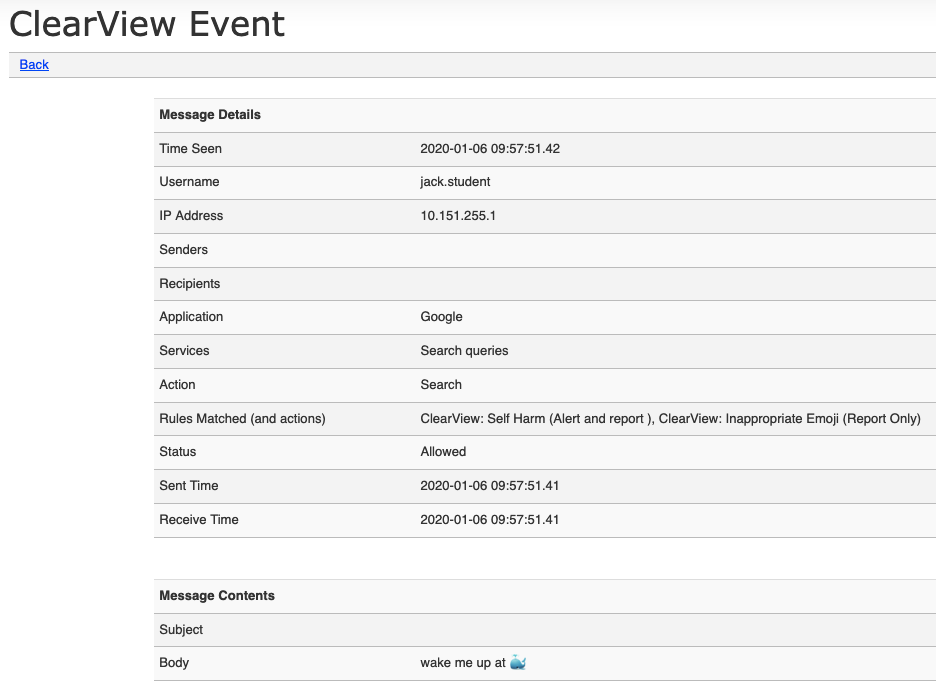
Click on [more] to drill down to the singular details. Click Back to return to the query screen.
ClearView Custom Queries
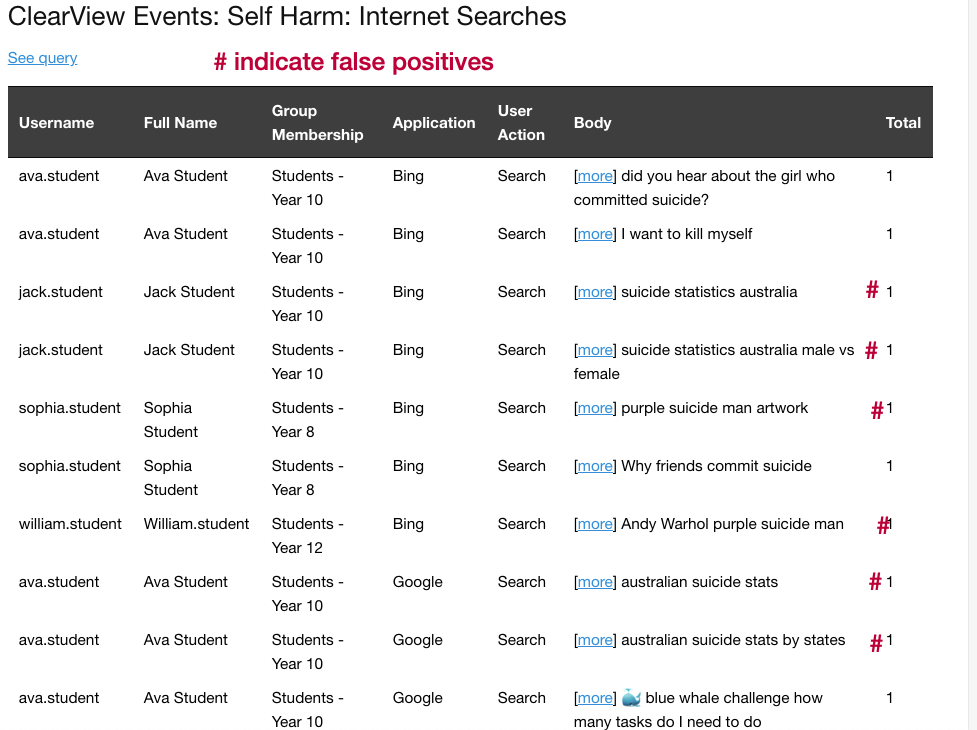
The ClearView Welfare report provides details on the digital behaviour of users which may warrant further investigation or actions for concerning behaviour. The queries for the report have been designed to filter results to specific activities, key user actions which allow quick assessment of activity. Results for SEARCHES provide insight into a users behaviour and interests which may highlight potential at risk situations. SENDS or RECEIVES results are combined to provide activity patterns. Who SENT an inappropriate message and who RECEIVED the message, aids in detecting a pattern or commencement of inappropriate behaviour which can be addressed before it escalates. Two queries have been built for each of the rules to define the results for reporting purposes, however all user actions are captured and can be view by simply deleting the Condition User Action.
Remove False Positives
False positives are results that have triggered one of the words or phrases from the ClearView pattern list, however they are generally not an activity that requires investigation. An example would be curriculum delivery where all students may be searching for a topic e.g. suicide statistics, and it is captured in reporting.
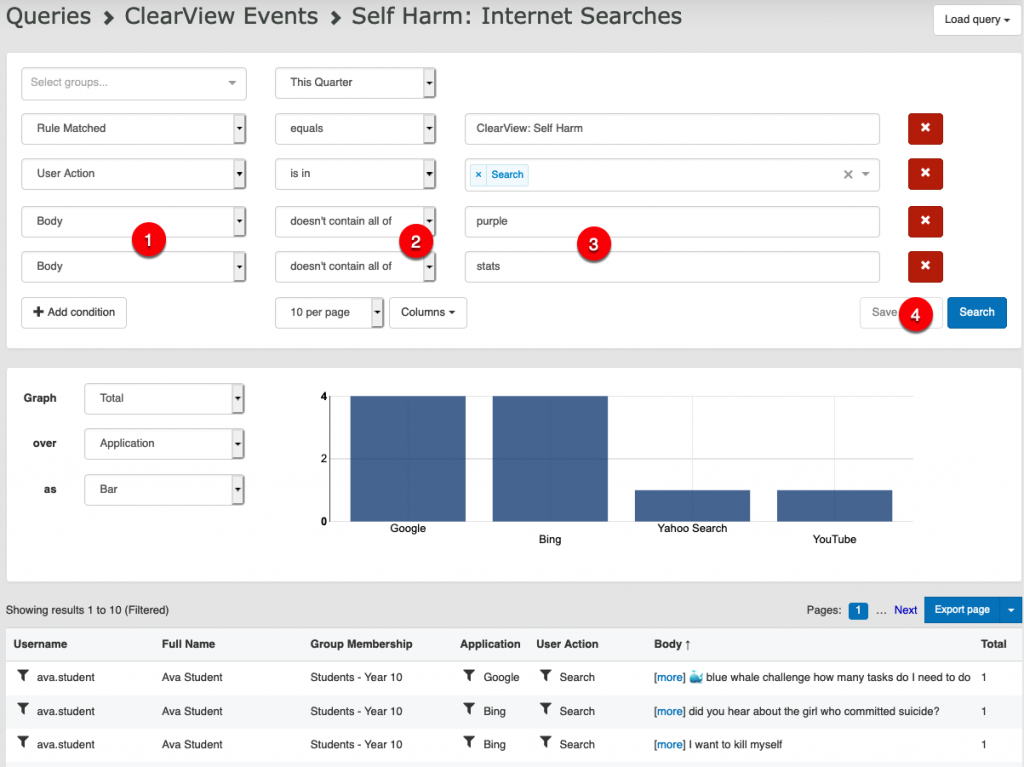
Removing these false positives from the queries view is easily achieved by adding a condition to filter out theses results.
- Add a condition and select ‘Body’ from the drop down list. Body is the heading the results appear under.
- Choose appropriate filter e.g. doesn’t contain all of.
- Type the word/s to filter out the results. In the example below, to filter out both false positives, add another condition to remove other words. e.g. purple and stats.
- Click ‘Search’ to update the view.
TIP: If the words don’t need to be captured ever, the System Administrator can add words to be excluded from the ClearView Rules, so they will never appear in future reporting.
Report Limited Activities
As demonstrated by the previous section, false positives can over populate the results in reports that are delivered. An example is a class of students all searching for suicide statistics or purple suicide art by Andy Warhol, it generates a large number of the same or similar results. The summary section of the report provides details of how many events have triggered.
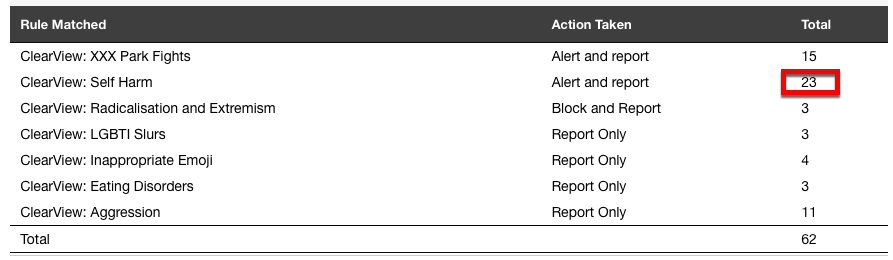
The default settings for how many events to display is 20 for the ClearView Welfare report, so the example provided above states that there are 23 events triggered, therefore 3 events are not visible in the report. Accessing the query directly from the report and filter out the false positives will provided all the relevant results to review.
Note: The System Administrator can change the default setting for each of the queries if more results need to be provided in report. The default for any new queries created is to display only 10 results.