Dashboard Configuration for System Admin
The dashboard offers greater visibility of key data and visualisation customisation enhancements. The following provides the steps to configure and provide access for different user groups.
Default Views
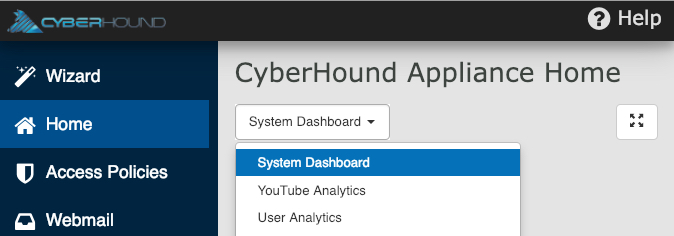
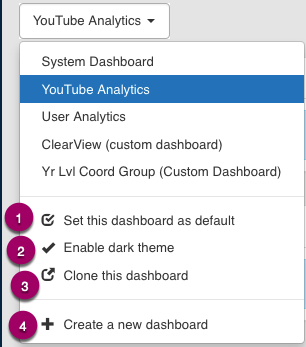
There are three default dashboards available to choose for the Home Page. Select from the drop-down list and choose how to display.
- System Dashboard
- YouTube Analytics
- User Analytics
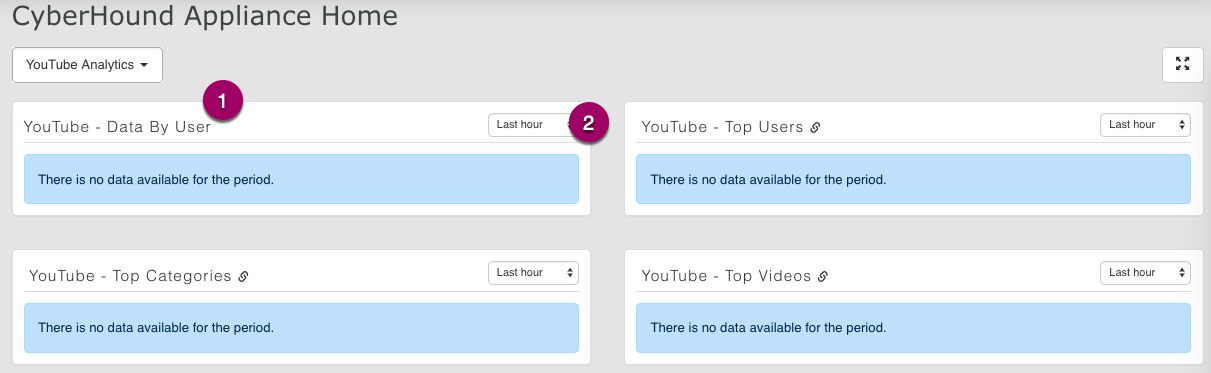
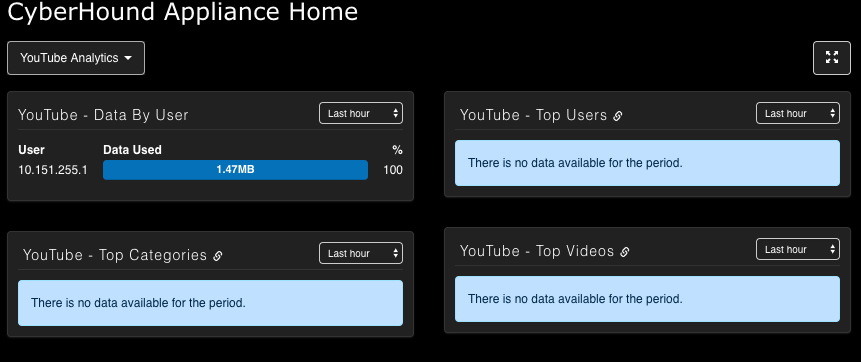
Click arrows icon to expand view to full screen e.g. Large monitor in IT department.
Each view can provide:
- Query Access – click link to access the relevant data source query.
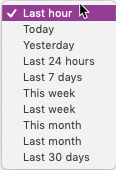
- Time – change to view data for a different time period.
Customise View
Option to choose which dashboard is the default and a colour theme for each new dashboard.
- Default– choose which dashboard is the view when on the Home page. Use either a default or custom-built dashboard
- Theme – change to view data is a dark theme mode (only for clone or custom-built)
- Clone – to use and then modify
- Create – build a new dashboard for specific user groups
Dark Theme
Dark theme can only be saved for a cloned or newly created dashboard.
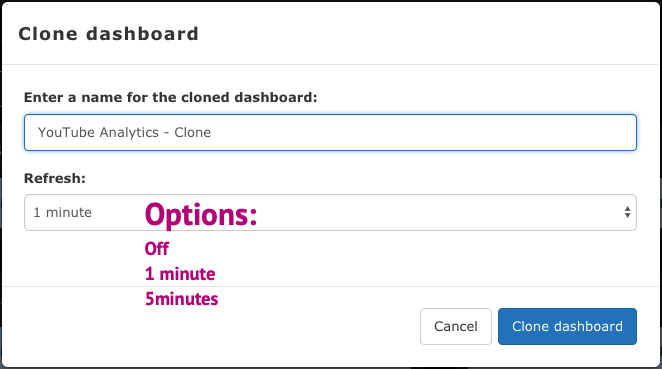
Clone
Rename the cloned dashboard and choose a time to refresh the data on the dashboard.
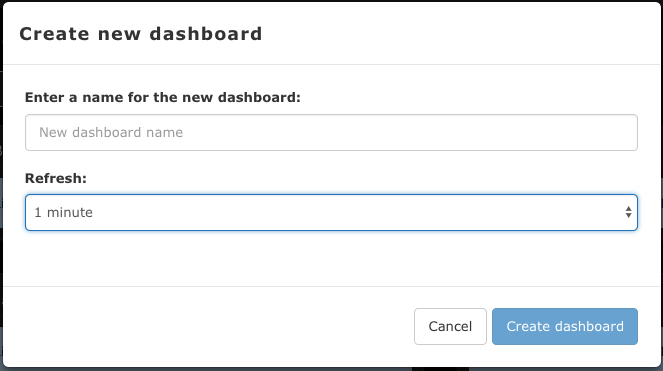
Create New Dashboard
Design a custom dashboard to meet the needs of different user groups. Name the dashboard and select a time to refresh the data on the dashboard.
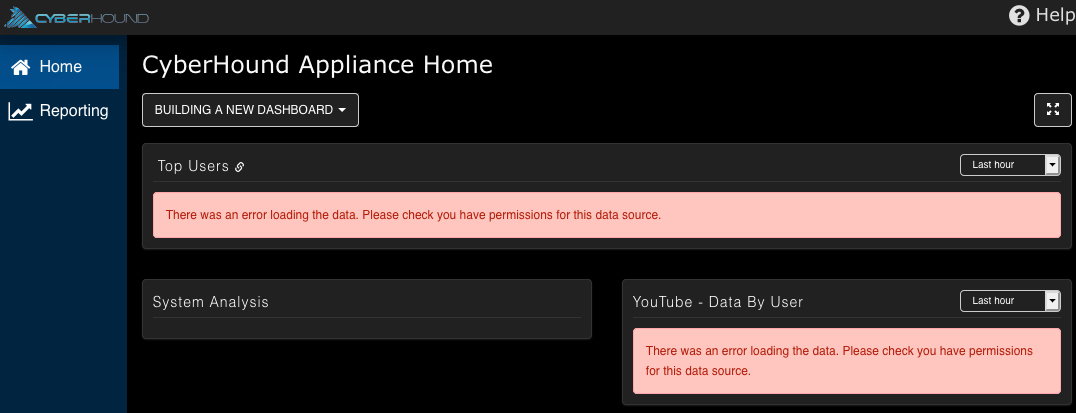
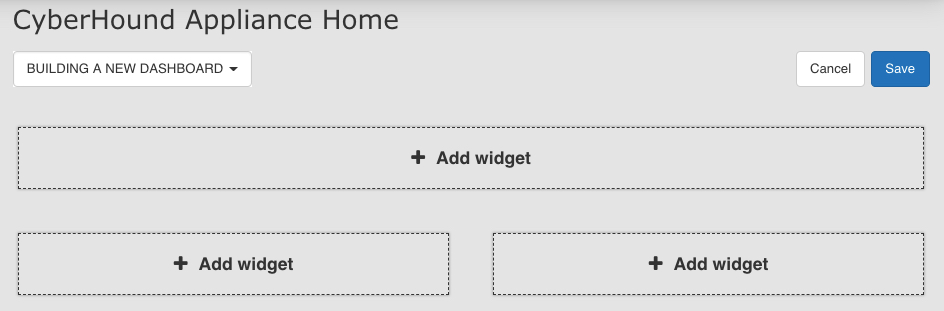
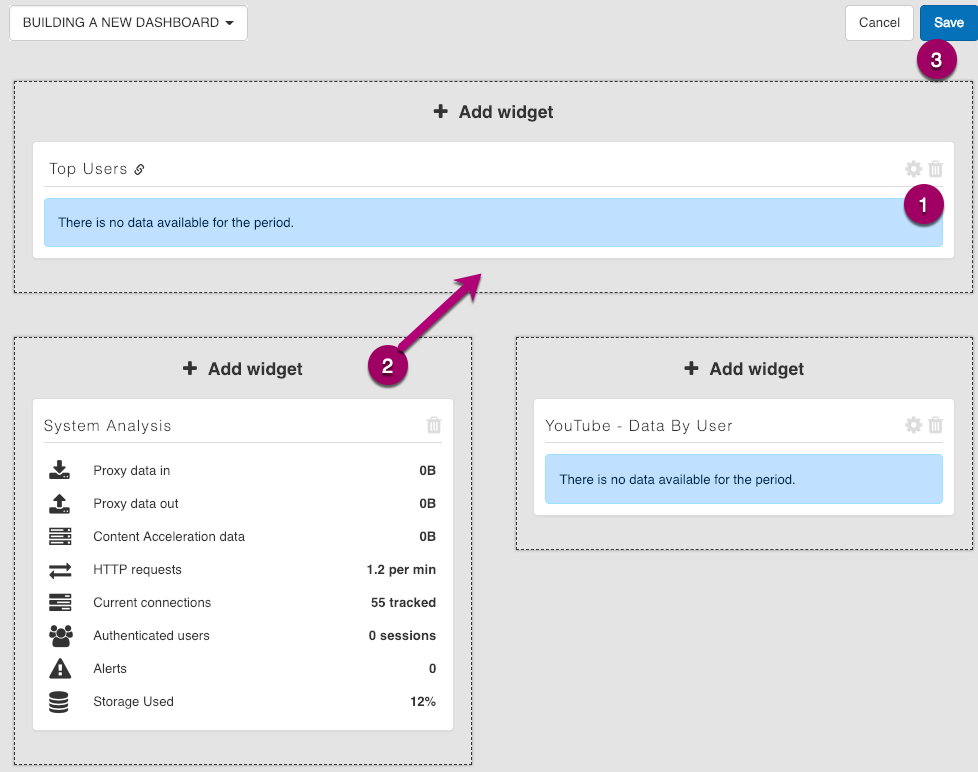
Build A New Dashboard
Once you have created the new dashboard, choose the layout and add the widgets. Simply click in the field where you want the data displayed. You can add multiple to each field or choose not to populate a field.
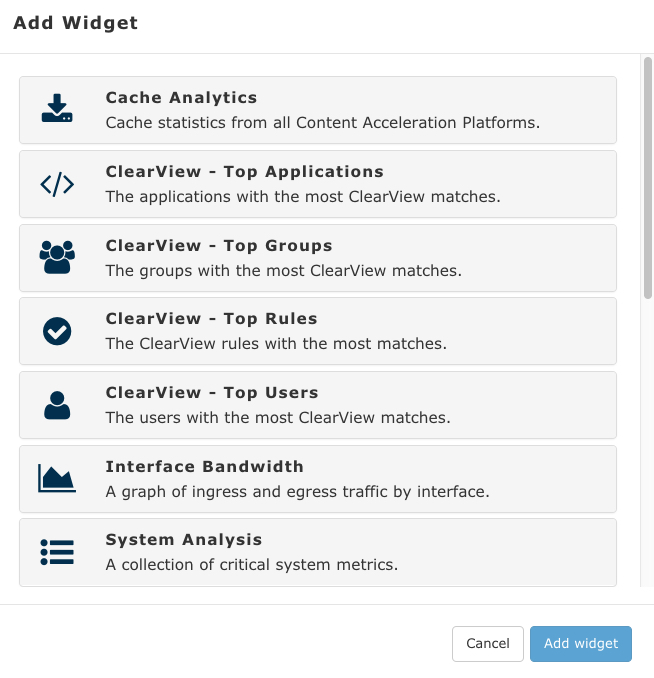
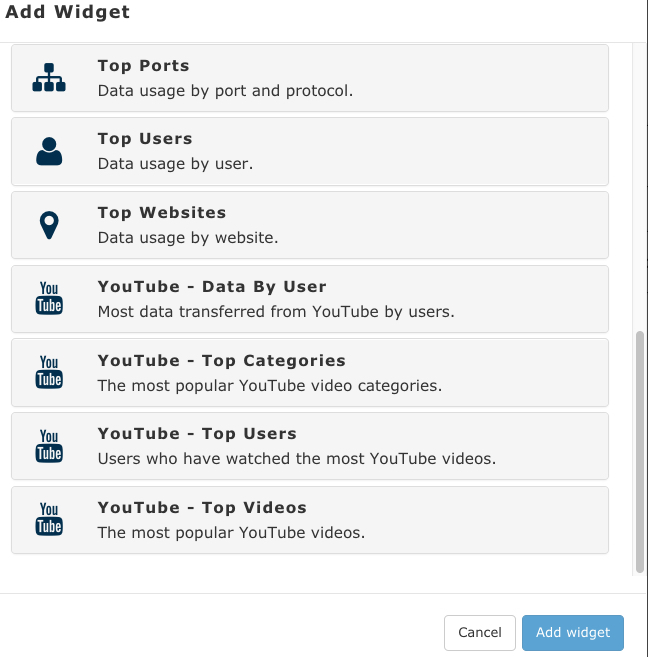
Add Widgets
When you click on the ‘+ Add widget’ field, there is a list to choose from and you can select any combination.
NOTE: If you are building a dashboard for a specific group, the results will only display if they have data source permissions to access. (see below for permission settings)
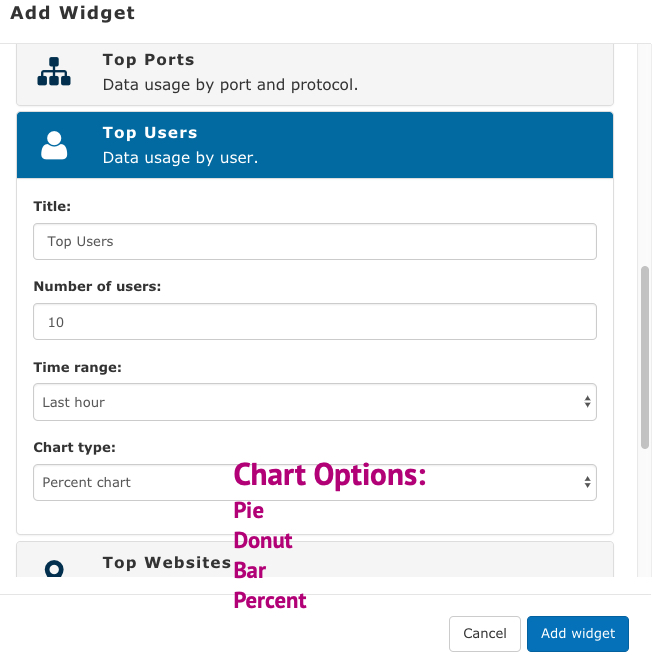
Widget Options
Each widget provides options to select how the data will be viewed. The following is an example of the most common options available. Depending on the widget, the options may vary.
- Title – change the name if required
- Number – choose how many to display
- Time– which default time period will be displayed
- Chart – choose how the widget is displayed
Editing Options
- Edit – Select icon to change the display view or delete
- Move – Click and drag to change position to another field or up and down in the same field
- Save – When layout is complete
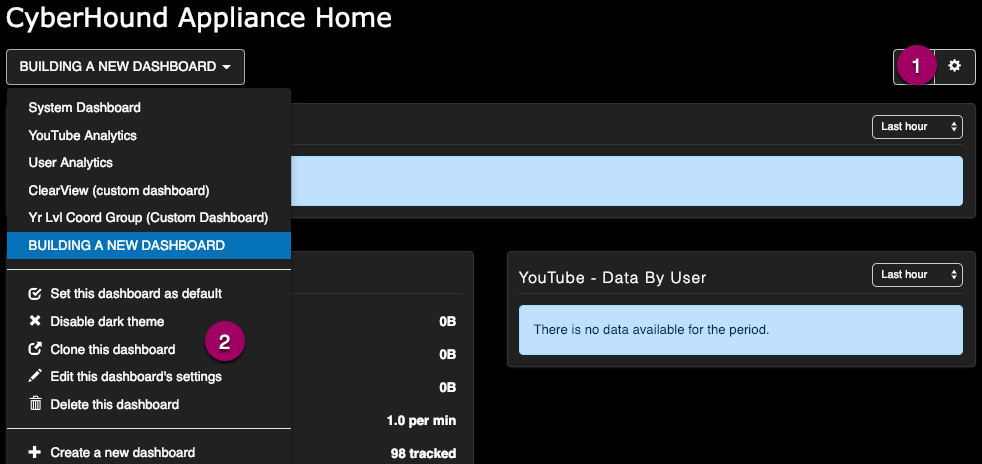
When saved the new dashboard will be available in the drop-down list.
- Select icon to edit if further changes are required
- Options to set as default or change to dark theme etc.
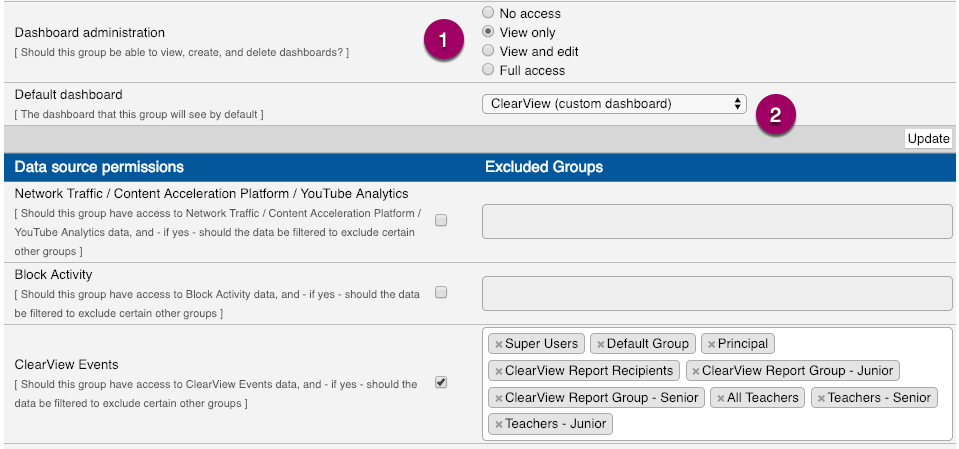
Permissions To View Dashboard
There is an option to provide the new dashboard for any group that has access to view data sources.
To set permission to view dashboard, access via sidebar navigation pane: Users & Groups > Manage Groups > [Edit] the relevant group
- Choose view option
- Select the relevant dashboard from the drop-down list
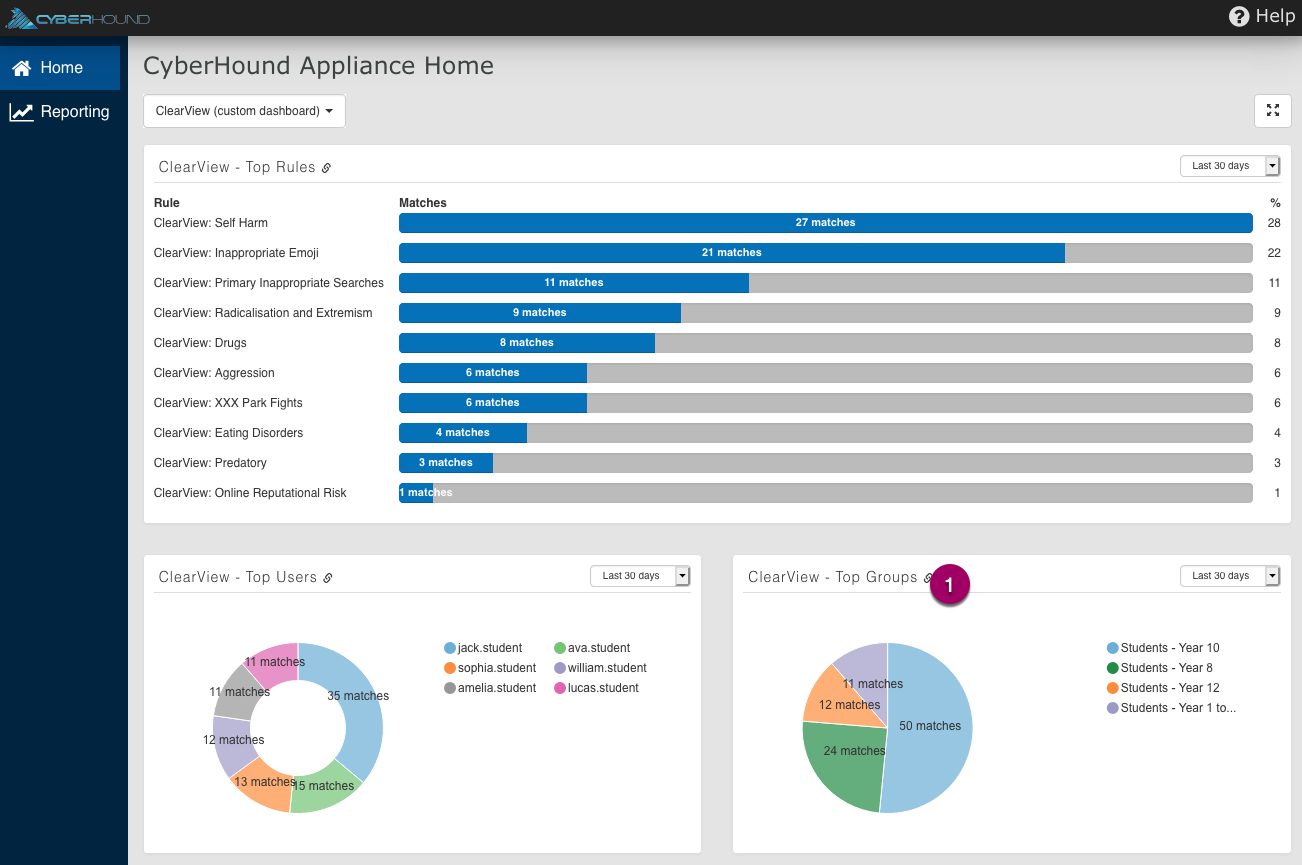
User view as per the permissions set above.
- The users datasource permission will allow them to access the query directly from the link on the dashboard view.
NOTE:
- If the group does not have access to data source, the results will not display on the dashboard if they choose another dashboard from the drop-down list
- The users do have the option to change theme, but it will not be saved. How the dashboard is created and saved is the default view for users
- Excluded groups data will not be visible